A manufacturing company is only as good as its equipment management. However, more importantly, it’s about how organizations utilize their equipment effectively. Without knowing the Overall Equipment Effectiveness (OEE) of manufacturing machines, companies risk losing ground in the highly competitive manufacturing environment.
By collecting and analyzing OEE data, users can better understand how efficient their equipment usage is, which is crucial considering the profitability that equipment brings.
An Overall Equipment Effectiveness dashboard not only displays real-time overall equipment efficiency for the workshop but also identifies trends, patterns, and improvement pathways, enabling manufacturers to enhance efficiency as part of their continuous improvement initiatives.
What is OEE Data?
Overall Equipment Effectiveness (OEE) is an important measure to assess equipment productivity and whether production time is effectively used. OEE data is collected from performance, quality, and availability metrics to aggregate information that helps manufacturers evaluate effectiveness and optimize processes. By optimizing these three factors, a business’s production operations become more cost-efficient and effective. It also provides data to improve decision-making in operations.
What is an Overall Equipment Effectiveness (OEE) Dashboard?
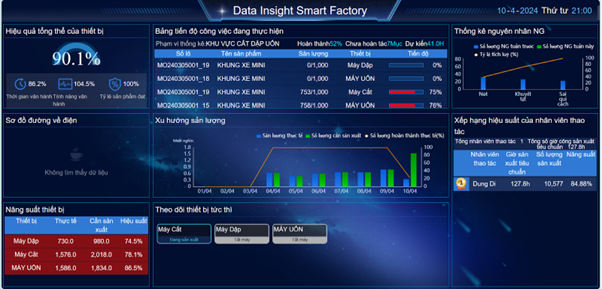
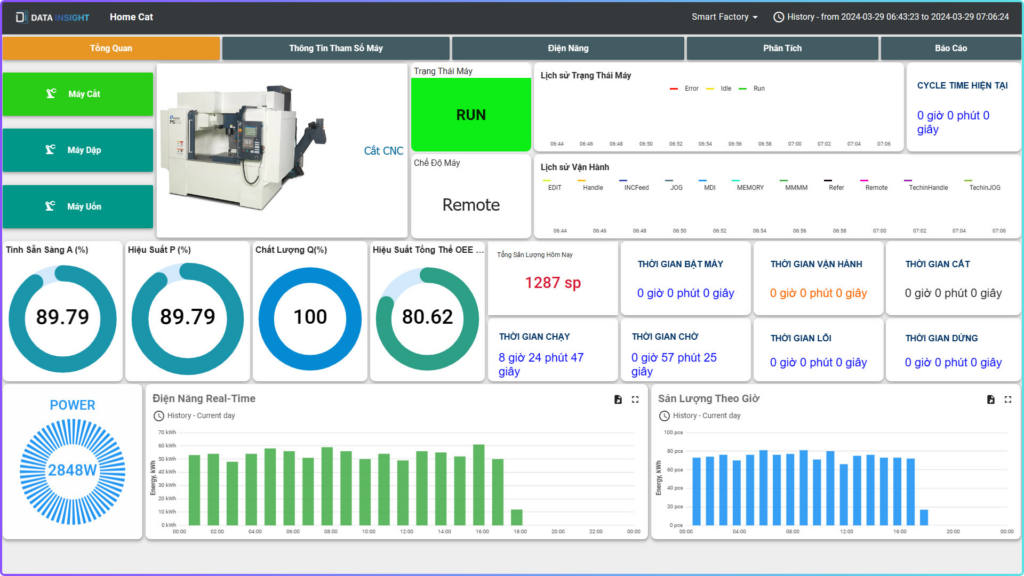
This is a production reporting feature that displays real-time OEE for easy access to production activities across the entire workshop.
The Kanban dashboard provided by Data Insight allows end-users to track progress by shift, batch code, and product code.
Assesses machine performance at any given time and the quantity produced up to that point for a batch. Identifies root causes of defects for improvement.
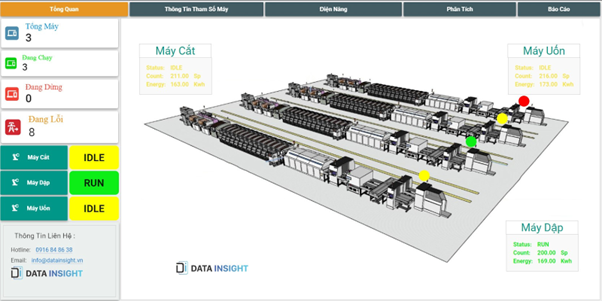
Identifies areas with poor machine performance and monitors machine status.
This enables remote monitoring for management, allowing them to monitor machine and employee effectiveness from their office or when not present in the workshop.

5 Benefits of Using OEE Data in Manufacturing
Improved Process Efficiency
In traditional manufacturing, not all processes are planned; some grow organically as businesses scale. Overall equipment effectiveness helps managers identify areas of the production process that need improvement. The holistic efficiency of equipment provides robust data to trigger process improvements and optimizations. It can also identify training issues and the need for consistent process steps from one shift to another. Another metric may be how a factory is laid out or process setup and changeover.
Waste Reduction
OEE helps identify quality issues in production to reduce waste and improve quality. This process is particularly effective when deep insights are generated in real time. Waste can result from quality errors, operator performance, and downtime due to machine breakdowns or unplanned maintenance. Data provided by OEE from Data Insight has the ability to show all factors so all factors causing waste are shown on the dashboard.
Reduced Downtime
Much machine downtime stems from daily operations. This downtime reduces machine availability, a critical component of OEE data. Overall equipment effectiveness can be leveraged to reduce short stops and common non-operating points in production operations. This deep information helps manufacturers identify areas that need intervention when conditions like coil whine, congestion and sudden stops occur. It also helps them deal with downtime, whether due to stock not being handled in time or waiting for a technician. OEE data empowers managers to minimize availability losses like this.
Enhanced Communication and Collaboration
OEE indicates device performance: OEE is an overall equipment performance indicator, demonstrating production efficiency in shifts, machines, departments, or entire production areas. When using real-time OEE data, scores are calculated impartially and accurately. This helps to accurately identify the production performance of each component in the manufacturing process.
Creating favorable conditions for communication and collaboration: OEE data is a reliable and objective source of production performance information. When workers and managers have the same “truth” about this data, they can communicate and collaborate more easily with each other. Improving the production process becomes easier when everyone can agree on the factual data from OEE.
Deep insights into change management and work processes: Companies can eliminate deficiencies, biases, and errors in communication by eliminating error-prone manual documents and replacing them with automated processes, digital document approvals, and more.
Improved Maintenance Performance
Improved maintenance strategies: OEE data allows managers to establish maintenance strategies that impact production productivity. By understanding the operational performance of equipment, they can plan maintenance based on these metrics to maximize productivity and product quality.
Improved performance and quality: Maintenance strategies based on OEE data help improve product quality by minimizing machine downtime. When machines operate longer, product quality is more stable.
Optimization of service and repair: OEE data also helps enhance coordination between maintenance, service, and repair operations. When these tasks are better organized, machine issues are handled more efficiently, and equipment health is optimized.
Changing the mindset about maintenance: Most importantly, using OEE data changes the perception of maintenance from “unnecessary expense” to an essential part of the production process. Maintaining machine health and performance is considered part of optimizing each device’s performance
Why Monitor OEE Visually?
Why Is Dashboard Important?

To answer this question, you need to understand their impact on production. The OEE dashboard stems from the need to eliminate human error risks and time delays, ensuring that equipment is used to meet production goals. To collect OEE more effectively, AIoT cloud-enabled machine data platforms provided by Data Insight gather data directly from machine controllers. This ensures that production data is real-time, accurate, and standardized across all devices.
Another profound insight into why dashboards are important comes from the value of real-time data. With data collected instantly, it can be displayed on OEE dashboards visually to allow real-time performance viewing. This ensures a comprehensive view of the manufacturing area for operators, managers, and executives.
Device dashboards allow users to quickly examine factors like downtime, production, and other variables, the impacts on quality and machine efficiency can be used immediately at the point of use. And control actions can be taken immediately to address or prevent issues altogether.
OEE Based on Human-Centric Data
When data is collected in real-time, the need to capture runtime, setup time, and other information manually is eliminated.
Human-centric data entry is also prone to errors so even when the time is recorded, the reason can be misunderstood or misinterpreted based on the recorder’s perception. By collecting data through sensors and devices, the human input requirement will be significantly reduced, except where it can be added to the data collection process automatically as contextualized.
This process promotes the best use applications where some human-added data is optimized for the issues encountered while directly producing for the precise data collection for the IoT sensor devices.
Factors of OEE
OEE can be effectively used as a standard to measure progress.
The OEE index is calculated by combining three factors below:
- Availability: Availability is measured by using scheduled and unscheduled stops. Planned stops include changes, minor conversion about settings or tool status. Unplanned stops include breakdowns, congestion, and lack of production materials. Because stopping either reason makes the operator record the reason (or, in the case of automatic machine monitoring, makes the system record the stop), it means loss of readiness.
- Performance: Loss of performance occurs when the equipment runs slower than the optimal speed for the technical parameters of that part. These losses include inevitable losses, such as those occurring during startup and process loss, where the process is not optimized. Process losses can occur due to slow cycle time, minor stop events, SOP breaks, or training and maintenance issues.
- Quality: Quality as an OEE factor refers to the total time used to produce quality defects. Including parts that can be remade to return to technical specifications. The time used to produce a faulty part will be subtracted from the total time, reducing OEE.
How to Use Overall Equipment Effectiveness (OEE) Dashboard Effectively?
There are some dos and don’ts associated with overall equipment effectiveness dashboards (OEE).
Dos:
- Customize to fit business KPIs: Because they are real-time tools, you can easily configure simple dashboards to meet user needs and support the most important production KPIs.
- Use information to improve decisions: Machine data collection devices connect data streams and allow for analysis that reflects the real status of the machines. Decision-makers can access the real situation when it occurs.
- Promote process improvements and optimizations: The information provided reflects the performance and status of machines but also provides opportunities for improvement.
Don’ts:
- Ignore data: Real-time data collection and analysis eliminate errors, biases, and mistakes caused by human intervention. Ignoring this information reduces the value of the dashboard and reduces the return on investment.
- Limit the value of machine OEE index: Learn how to use this system’s modes and view modes. Keeping it in plant or shift view means missing out on positive intervention opportunities.
- Use it as a disciplinary tool: OEE is one of several machine monitoring indicators that can enhance operational effectiveness. Do not use it as a tool to divide. Use it as a tool for training, inspiring, and improving productivity.
Using OEE Dashboard Connected by Data Insight
Data Insight provides a powerful, best-in-class system to collect, standardize, and perform data processing. Reports and dashboards are available, such as real-time OEE information boards. These dashboards can be accessed at each machine, production department, and in management offices.
By using OEE information from Data Insight, operators, technicians, and managers have access to customizable data that can be optimized and rationalized for operations. This real-time information is analyzed for data collection to be used immediately to take action.
The system is very flexible, allowing enterprise operators and factory floor operators to simultaneously access the same information. This means companies can use this information to make strategic and tactical decisions, with everyone working with their own version of reality.

If you’re interested in how Data Insight provide you our OEE software, improve efficiency of your plant and drive profit for your business, don’t hesitate to schedule a demo with our team.
Contact us now at!
DATA INSIGHT TECHNOLOGY VIETNAM COMPANY LIMITED
- Hotline: 0916.848.638
- Hanoi office: Số 6 Kim Đồng, phường Giáp Bát, Quận Hoàng Mai, Thành phố Hà Nội, Việt Nam
- HCM City office: 99 đường Cộng Hòa, Phường 4, Tân Bình, Thành phố Hồ Chí Minh, Việt Nam


